Population 7,798 (US Census 2020)
Situation Town had a downturn because of a lumber mill closing.
Action Built a funky town around the funky niche of a mythical monster.
Result 237 Million in tourism dollars are spent in the are.
Let’s Meet Rhinelander, Wisconsin
History
Rhinelander was first conceptualized and created as a lumber town since it sits on the banks of the Wisconsin River. Brown’s vision of Rhinelander being a lumber town did not come to fruition for some years. Anderson Brown, managed to convince their father and uncle to purchase the land from the federal government and build a town. The city was named Rhinelander after Frederic W. Rhinelander of New York, who was president of the Milwaukee, Lake Shore and Western Railroad at the time. Unsurprisingly, in 1882, the railroad company was soon to follow with a railroad in and out of Rhinelander for the lumber industry.

Tourism
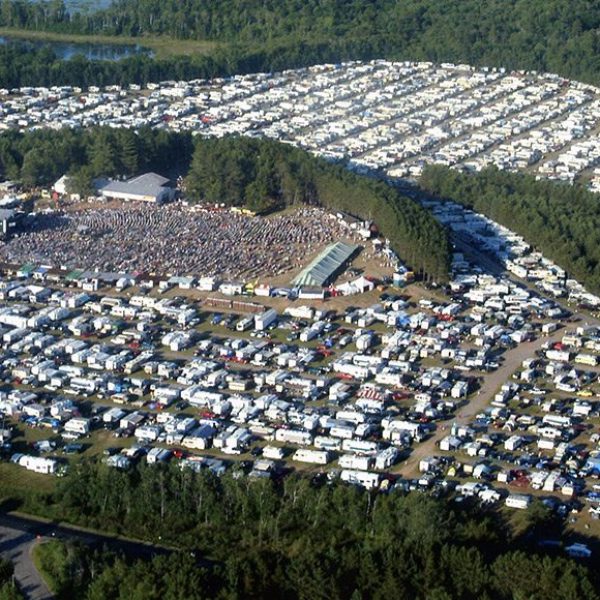
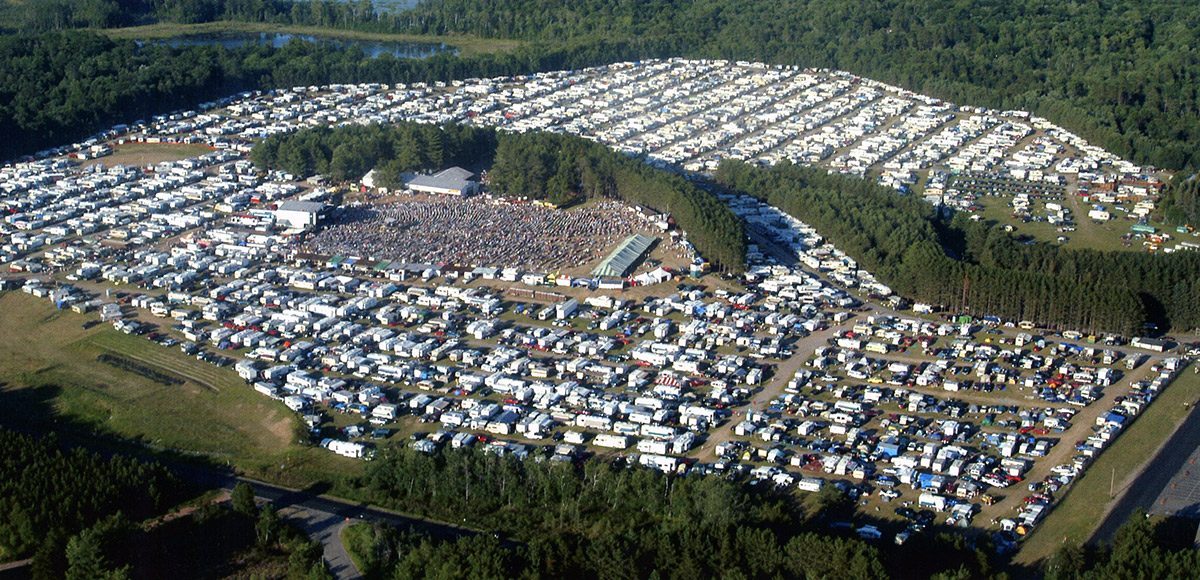
Tourism statistics on Rhinelander, Wisconsin are thin. There is data on the county in Wisconsin that Rhinelander is located. Oneida County is the name and Rhinelander is the largest of the three main towns in the area. The county itself brought in 237 million in tourism and it is on the rise. Rhinelander uses both traditional tourism and creative city developments to create this wealth.
Some of the main, more traditional tourist activities that bring people to this region are outdoor activities are hiking, camping, boating, canoeing, and bird watching. In the winter, cross country skiing, snowshoeing, and snowmobiling. They have year round offerings for tourists.
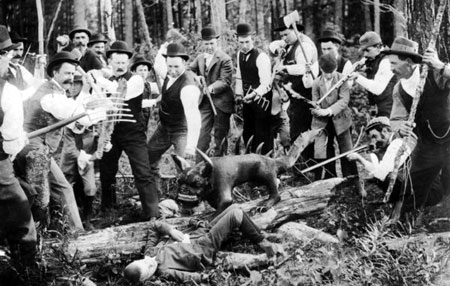
The creative town development I would like to focus on is the Hodag. Hodag is an urban legend dating back to 1892. The Hodag is a fearsome monster that roams central Wisconsin, the chupacabra, Bigfoot, or any other well known but impossible to photograph creature. Artist interpretations can be seen all over the cities website and a giant statue in one of the towns parks. The original description of the Hodag was reported as such:
“Hodag had the head of a frog, the grinning face of a giant elephant, thick, short legs set off by huge claws, the back of a dinosaur, and a long tail with spears at the end. The Hodag also had green eyes, huge fangs and two horns sprouting from its temples.”
What is very odd is this description of the Hodag greatly represents a native american myth of the “water panther: along the lake superior shore.
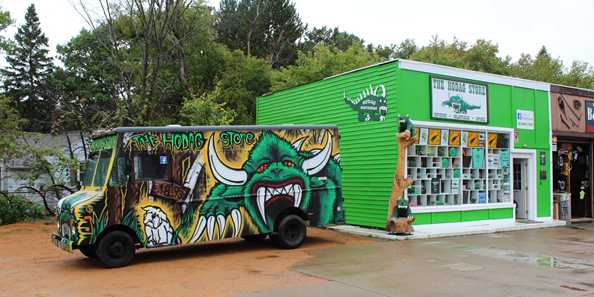
Whether the Hodag is a myth or not, Rhinelander’s love of the Hodag is not. THeir chamber of commerce has an oversized statue of the Hodag. There are pictures, murals, and paintings of the Hodag throughout town.
The town’s promotion of the Hodag is what creates interests around the town. Think about it like this – Tourists have many many options for where to stay while they explore the remote forests of Wisconsin. Much of Wisconsin is undeveloped land, so tourists have options but the reason to go to Rhinelander over these other towns is that they are funky. Would you rather go to a normal town or a funky one?
Buckle up, incoming Batman quote: “as a symbol… as a symbol I can be incorruptible, I can be everlasting.” and that is what Hodag Wisconsin has. Hodag is a long term symbol that has given its residents something to talk about and make their own. It is their creative city development they have used for over a hundred years. Just look at how they name different businesses and events in town:
- Hodag Lake (a small public-access lake west of Rhinelander)
- Hodag Park (on the shores of Boom Lake in downtown Rhinelander; home to Hodag Water Ski Shows in the summer)
- Hodag Sno Trails (Rhinelander’s snowmobiling club)
- The Hodag Store
- 3 Hodag Country (WHDG)
- Hodag Farmers Market
- Hodag Run For Your Life (5K/10K/half marathon hosted by YMCA of the Northwoods)
- Hodag Lanes (bowling alley in Rhinelander)
- Hodag Pump & Pantry
- Hodag Property Management
- Hodag Honda
- Hodag BP

What the Hodag represents
The Hodag represents prosperity, not itself but for the town. Creating a myth has bonded the people of Hodag, given visitors something to talk about when they return home, Created objects, like statues, representing the myth that compounds the tourism interest in the area. The Hodag as a creative city focal point has allowed the city to sustain growth, retain residence and draw tourism. It is nothing less than a success.
Summary
The Hodag is a myth/symbol that has united Rhinelander wisconsin and is their creative city development that drives tourism. Starting a myth is low cost – Look at Remer, Minnesota, home of the Bigfoot – and last for a long time.

Whether or not the Hodag is real, besides the horns and the lizard-like body, the most noticeable feature is its’ ability to bind a town around it.