Population 17,887 (US Census 2020)
Situation Anoka has a rich history that is only becoming richer by celebrating something they love, Halloween. Unlike Salem or New Orleans, this wasn’t done from it’s haunted nature but as a matter of.
Action Leaned into a 1920 origin story and built a month-long civic Halloween calendar that draws regional visitors every October.
Result not reported
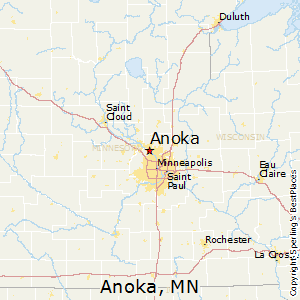
Let’s Meet Anoka, MN
Anoka has a rich history that is only becoming richer by celebrating something they love, Halloween. Unlike Salem or New Orleans, this wasn’t done from it’s haunted nature but as a matter of practicality. The town was being ransacked by pranksters on Halloween and they needed to do something to curb the damage done.
Early Anoka, Minnesota
Anoka, Minnesota is the area between the Rum River and the Mississippi. It was occupied by the Dakota and later pushed out by the Ojibwa. Father Louis Hennepin, the person the whole county is named after was the first white/European to explore the area in 1680. In 1844 settlers came to stay. Joseph Belanger would build himself a log cabin along the east side of the Rum River, which would become the areas trading post. Shortly following the logging industry would start booming leading the way for ancillary industries like barrel making, saw mills, and other woodworking facilities.
Anoka Before Their Creative City Development
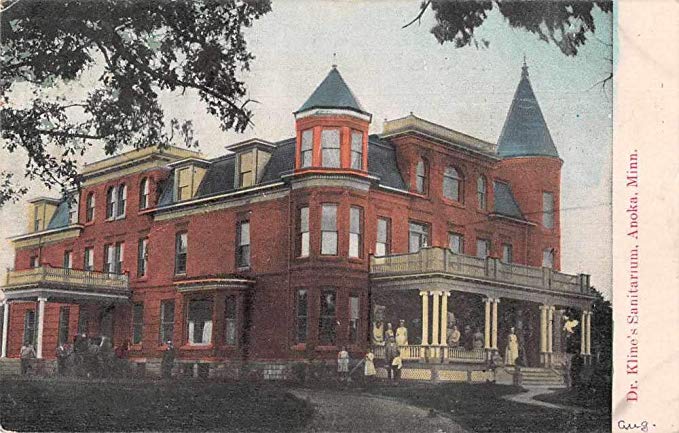
In the next 20 years the logging industry would fall away and a potato starch factory would be created, shoe factory, and by the turn of the century had a hospital of their own.
History of Anoka, Minnesota
Anoka became the Halloween capital of the world in order to curb the Halloween pranks. The pranks must have got so out of had that is bonded together the merchants of the town and other local figures. Every year cattle and farm animals were being set loose, chickens and wheelbarrows on people’s roofs, and probably the biggest incentive of all, the outhouse tipping with people in the outhouses. The idea was to create such a scene of entertainment and goodies that they would pull the troubled youth off the streets pulling pranks and into the greater party.
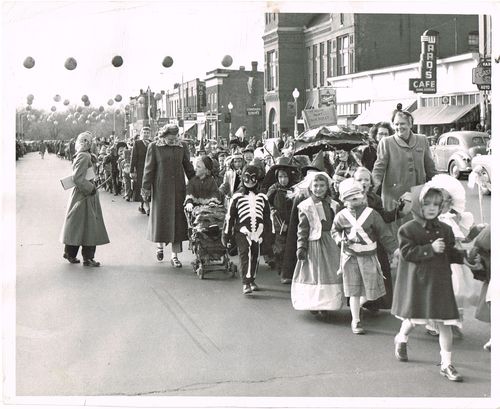
So How Did Anoka Become The Halloween Capital of the World?
Since 1920, Anoka has hosted the Halloween festival every year except two due to World War 2. In it’s growing evolution, Anoka has added a costume contests, giant pumpkin weigh offs, haunted houses football games, block parties, a 5k run, and multiple parades.
How Has Anoka Prospered?
Anoka’s long running Halloween tradition and the associated memorabilia is sought from people all over the world. This same memorabilia is collected into the Anoka History Center Museum that runs year round letting Anoka capitalize from their once a year parties year round. This museum also features other important artifacts to Anoka.
Is Anoka Doing Too Well with Their Creative City Development?
Anoka, for the first time in almost 100 years has competition for the “Halloween Capital of the World”. Not unlike Willow Creek, California and Remer, Minnesota, Orlando Florida is re-branding as the “Halloween World Capital”. Anoka and Orlando could drum up free PR by playfully fighting for the title for the Halloween Capital.
Other Attractions Near
Anoka, Minnesota unlike other towns didn’t change their city out of desperation or lack of income but instead to solve a problem – complete Halloween prank chaos. They did this by making something that would draw even more attention to the community and was even more fun than tipping an outhouse while someone is in it. Not only did Anoka solve their immediate problem on destructive pranks but created an event that they have profited from for almost 100 years.
FIll Out to Receive the Ebook!
People may come for the Halloween festival but they come back for the natural beauty, canoe friendly rivers, and antique shopping. As every business owner knows, a return customer is your best customer.
Why Other Towns Should Follow Anoka’s Lead

Anoka ran the same play any town can run: pick one anchor, commit to it for decades, and protect the off-season programming. Leaned into a 1920 origin story and built a month-long civic Halloween calendar that draws regional visitors every October.